Overview
Pathways to the Future: Transportation 2050 is the Richmond region's long range transportation plan (LRTP). It outlines significant transportation needs across the region through the year 2050, covering all nine localities and travel modes. This plan is a dynamic document that not only sets a vision and goals for regional transportation but also prioritizes projects based on these goals.
As a fiscally constrained plan, it includes financial strategies to show how the proposed transportation improvements can be implemented. PlanRVA creates a 25-year plan and updates it every five years, per federal mandate.
For the 2050 update, we continue the vision from the last plan: The transportation system in the Richmond region will reliably and safely connect people, provide opportunities for all to thrive and live healthy lives, promote a strong economy, and respect conservation of natural resources.
Draft Plan Review: July 29-August 30
See all the pieces together and provide comment on the review of the Draft Plan.
How much money are we talking about?
There is a set budget for all federal investments for the region: $32.5 billion.
First, we must "remove"...
approximately 57%: for maintaining and operating the existing system (e.g. repaving, fixing busses)
approximately 13%: allocations to our member local governments and transit operators for local-level projects (e.g. sidewalks, roundabouts, bus replacements). We don't dictate what it is used for.
That leaves about $9.5 billion for regional money. Some of that is already allocated for projects that are currently being built.
This gives us $7.9 billion out of the total $32.5 billion to plan for projects for 25 years from now (e.g. high capacity, of regional significance).
This is what we can use to make up the 4 investment scenario packages you were able to weigh in on before the final.
Each was semi-equivalent across mode (roadway, transit, bike/pedestrian), which is the intent of our benefit scoring that we use for all projects.
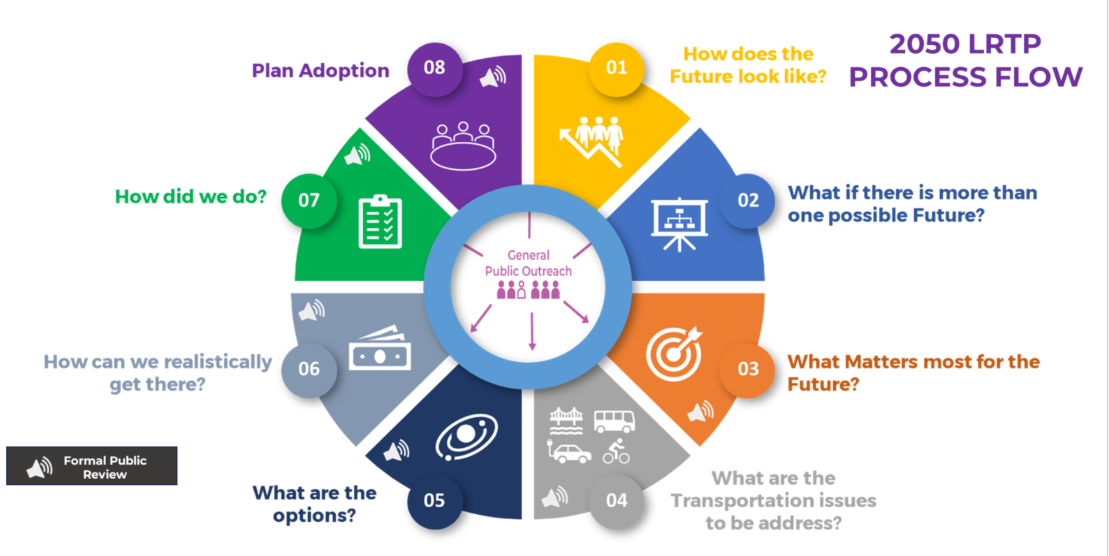
Process that takes place over two years of the update period. This 2050 update will be complete Fall 2026.
Draft Comment
After two years of work and public input, the DRAFT is ready of the Long Range Transportation Plan: 2050, which is the plan for the future of $7.9 billion of investment in transportation projects of regional significance for the nine counties in the Richmond region.
We'd like you to:
-Click the + in each section below to see the highlights.
-Review the final draft document and technical reports.
-Give your comments at the bottom of this page on the survey.
DEADLINE: Sunday, August 30, 2026.
We've pulled out important parts of the draft for you to see below, but we encourage you to view the entire Draft document and Technical Reports.
Check out our Public Events section on this page to see where we'll be in the region over the next 2 months if you want to see us and chat in person.
The draft of the Long Range Transportation Plan: 2050, is the plan for the future of transportation projects of regional significance.
What is eligible as regionally significant projects?
The long-range planning process includes:
- Evaluating the current transportation system and existing conditions in the region;
- Developing projections of population and employment growth to the year 2050;
- Creating a travel demand model to help predict future impacts of transportation decisions;
- Developing vision, goals and objectives to guide the plan (boxes below);
- Identifying issues and needs for the region;
- Locating and describing problems with the current system;
- Developing a Universe of Projects, containing possible solutions to meet identified needs and issues;
- Understanding the ability of the region to afford the range of possible improvements; and
- Creating a budget-realistic (or constrained) plan of projects by time bands.
- Evaluating the future transportation system against the plan’s Objectives in a range of different plausible futures.
Guiding Principles
GPl. Provide a safe system for all users by using proven strategies in planning, design, operations and maintenance as well as advances in technology to eliminate fatal and serious injury crashes.
GP2. Offer choice among all travel modes regionwide.
GP3. Expand the regional bicycle and pedestrian networks to provide active travel alternatives to driving, for better individual and community health.
GP4. Develop a robust transit network which delivers comprehensive, effective, and convenient service, particularly in areas of greatest need and to key destinations.
GP5. Ensure fairness in all transportation spending and planning decisions in the region with a focus on transportation in under-resourced communities.
GP6. Provide for the efficient, reliable and resilient movement of people and goods across the transportation network.
GP7. Align transportation investments and planning with land use, conservation of natural resources and community health.
Read and download Goals section.
Goal A: Safety: A transportation system where no one is killed or seriously injured, and people feel secure and comfortable regardless of how they travel.
| Objectives |
| A1. By 2050, the number of people killed or seriously injured on all roadways will be reduced by l00%. |
| A2. By 2050, the rate (per 100 million VMT) of people killed or seriously injured on our roadways will be reduced by 100%. |
| A3. By 2050, the number of people killed or seriously injured while biking and walking on our roadways will be reduced by 100%. |
| Strategies |
| AS1. Implement complete street policies including adding sidewalks and crosswalks, and other proven measures that prioritize the safety and comfort of all users, including people walking, biking, riding the bus, and driving. |
| AS2. Support the deployment of new vehicle technologies that better protect people inside and outside of motor vehicles. |
| AS3. Promote awareness of the rules and responsibilities of the road and efforts to reduce dangerous behaviors. |
| AS4. Prioritize a systemic approach to safety investments to reduce the overall risk of the transportation system in a cost-effective manner. |
Goal B Sustainability: A cleaner transportation system that provides choices and meets the needs of the current generation and provides the same opportunity for future generations.
Objectives |
B1. By 2050 the percentage of volume of freight moved via intermodal transportation (rail or through the port) will increase by 50%. |
B2. By 2050, the average jobs and weighted destinations per capita accessible within 30 minutes by all modes (driving, transit, biking, walking) at AM Peak Hour (6:30AM-8:30 AM) will increase by 75%. |
B3. By 2050, the percentage of residents and jobs within one-half-mile radius of public transit lines will increase by 70%. |
B4. By 2050, the total daily vehicle miles travelled, and the average number of vehicle miles travelled per person each year will be reduced by 10%. |
B5. By 2050, transportation related emissions per capita per year will be reduced by 75%. |
Strategies |
BS1. Make active transportation the most convenient option for shorter trips through infrastructure that is safe, accessible and comfortable for users of all ages and abilities. |
BS2. Make transit a desirable option for longer trips in the region and beyond with service that is frequent and reliable. |
BS3. Prioritize highways, rail, and port improvements that address freight bottlenecks and delays to ensure efficient movement of goods. |
BS4. Support the adoption of electric and other alternative fuel vehicles and the deployment of needed charging infrastructure. |
BS5. Support upward economic mobility by improving workers' access to jobs through reliable multimodal transportation options. |
BS6. Coordinate land use planning with transportation infrastructure capacity and planned investment. |
BS7. Prioritize multimodal transportation infrastructure improvements in Regional Activity Centers and Local Development Centers. |
Goal C Reliability: A consistent and predictable transportation experience for all people regardless of how they travel.
Objectives |
Cl. By 2050, peak-hour traffic delays (hours of delay) will be reduced by 70%. |
C2. By 2050, the percentage of single-occupancy vehicles trips will be reduced by 70%. |
C3. By 2050, the average annual daily transit ridership will increase by 75%. |
C4. By 2050, the miles of dedicated infrastructure for biking and walking will increase by 25%. |
CS. By 2050, the Bridge & Culvert Deck Area on the National Highway System classified as in ‘Good’ condition will increase to 70% and 'Poor' condition will be reduced to 0%. |
C6. By 2050, the pavements on the National Highway System which are in good condition will increase to 70%. |
Strategies |
CS1. Deploy advanced intelligent transportation system (ITS) infrastructure to support a high level of accuracy in real-time travel information provided to the public and coordination across all modes of travel. |
CS2. Expand dedicated infrastructure for transit and active transportation to provide reliable commutes across all modes of travel. |
CS3. Encourage mode shifts, shared rides, telework, and other demand management approaches which reduce peak hour demand for highway usage. |
CS4. Ensure adequate maintenance and repair of bridges and pavements to keep them in a state of good repair. |
Goal D Resiliency: A transportation system that prepares, withstands, and recovers quickly from disruptions caused by natural disasters, extreme weather events, and other emergencies.
Objectives |
D1. By 2050, 10% of the at-risk transportation infrastructure on the LRTP Network will be improved to withstand extreme weather evets and natural disasters. |
D2. By 2050, the redundant capacity of the Transportation Network in the PM Peak Period (4:30-6:30 PM) will be increased by 5%. |
D3. By 2050, the overall average systemwide Transportation Network connectivity will be increased by 2%. |
Strategies |
DS1. Conduct comprehensive vulnerability assessments of the transportation system to identify critical infrastructure and high-risk areas. Ensure critical infrastructure and infrastructure in high-risk areas are located or designed to avoid or withstand identified hazards. |
DS2. Develop Response Mechanism for different system disruptions. |
DS3. When planning for diversion and detour routes, incorporate information related to weight-restricted bridges, and roads with substandard pavements and geometric features. |
DS4. Invest in resilient materials and technologies for infrastructure construction and maintenance. When existing vulnerable infrastructure is damaged by extreme weather including extreme heat conditions, make the additional investment required to rebuild it to withstand similar events in the future. |
DS5. Prioritize enhancement of transportation network connectivity and multimodal redundancy to ensure swift and reliable emergency responder access during and after destructive events. |
DS6. Minimize construction of new infrastructure in flood-prone areas and avoid the disturbance of natural resources that help buffer communities from flooding and extreme weather. |
DS7. Develop and enhance community engagement and communication strategies to educate the public and increase awareness about disruptions to the transportation |
See the Completed Input tab on this page for more about what the public told us.
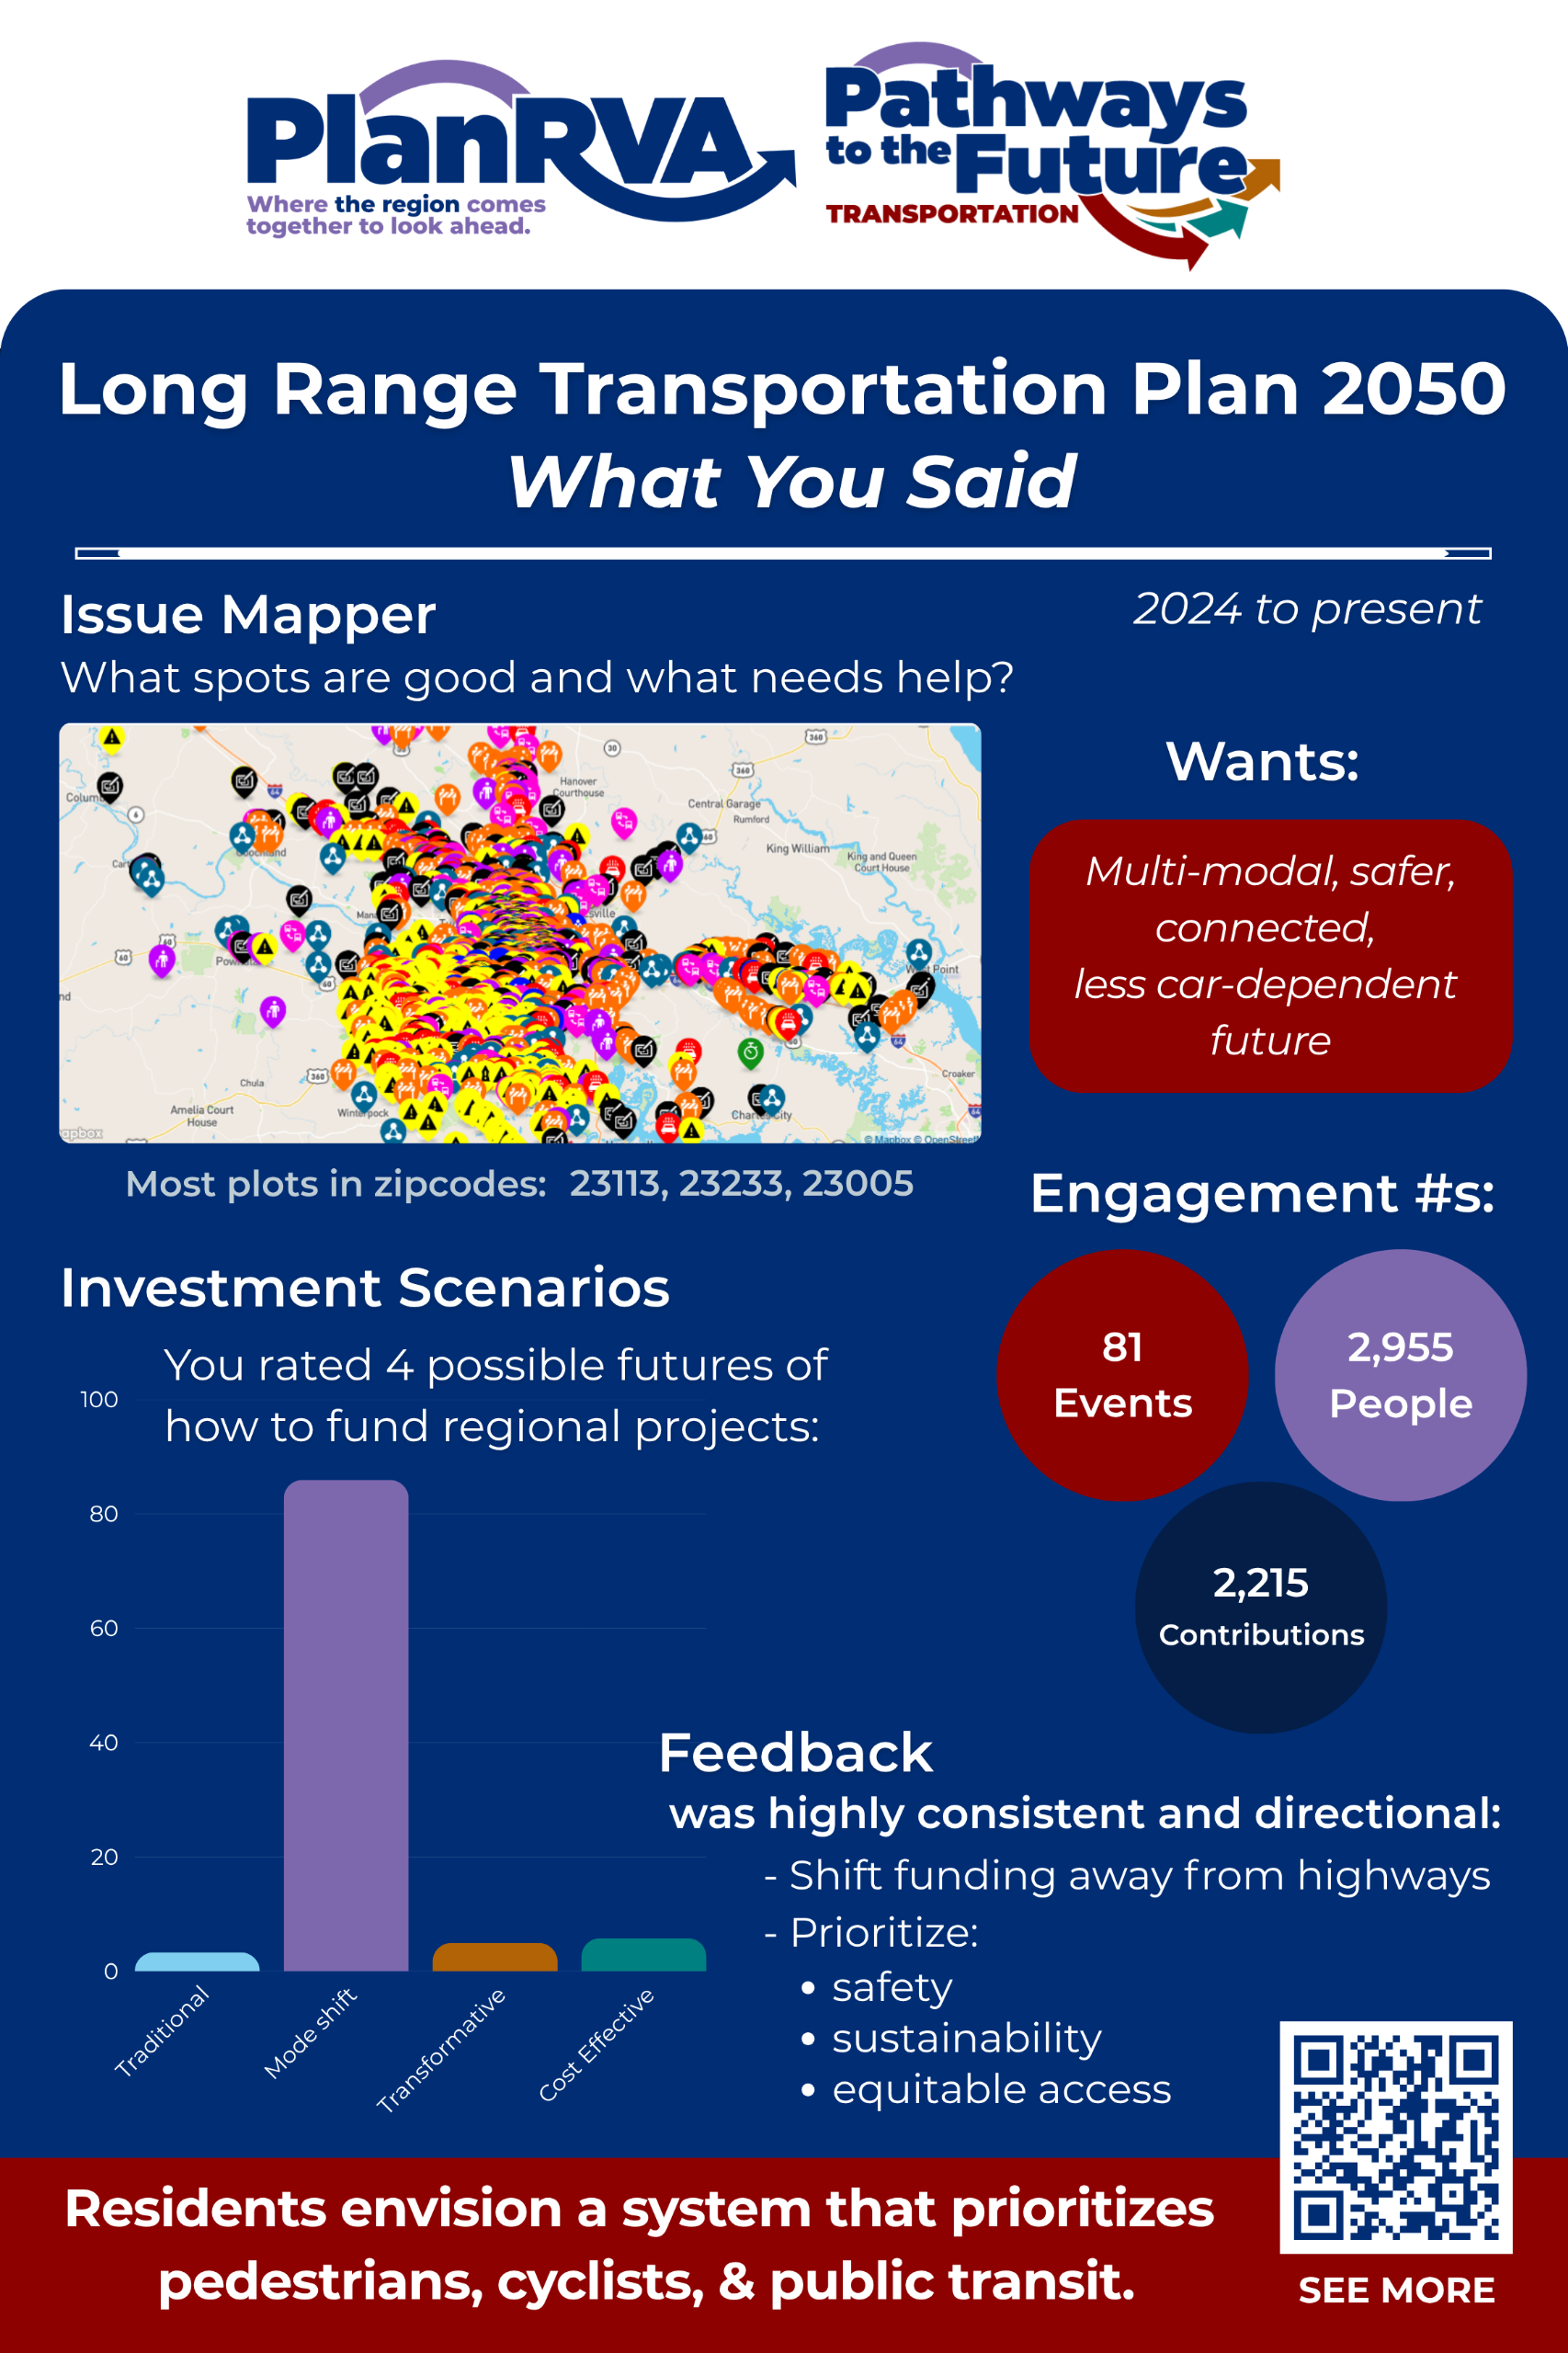
From Fall 2024 to now, we've engaged over 2,955 people across 81 events (and still counting!). We've received 2,215 contributions of your input.
Feedback was highly consistent and directional:
- Shift funding away from highways (see: what's in highway).
- Prioritize: safety, sustainability, and equitable access.
Engagement includes:
- regular input from an Advisory Work Group of subject matter experts from our localities
- Three dedicated, in-depth, periods to reach out to, get input from, and reconnect with many of the same groups over the 2 year process.
- Regular conversations and sharing on social media, newsletters, in the press, in board meetings, and at public events.
List of projects by locality
Title VI Analysis: Identifies the region’s minority, foreign born, and populations with Limited English Proficiency (LEP) as indicators of protected classes and those historically underserved.
Analysis of the constrained plan transportation projects here indicate:
- 52% of the project mileage coverage and
- 56% of the dollars are expected to serve these areas.
The population in these areas represents less than 51% of the overall regional population.
Thus, this supports the finding that the proposed investments are proportionally distributed. This ensures that Title VI communities are not overlooked in funding decisions.
The Environmental Justice analysis builds on the demographics mentioned in the Title VI analysis with these additional factors: low-income, disability, female headed households, without a vehicle, cost burdened, and 65+.
Analysis of the constrained plan transportation projects here indicate:
- 27% of the project milage coverage and
- 34% of the dollars are expected to serve these areas.
The population in these areas represents about 28% of the region’s total.
Thus, this supports the finding that communities that have traditionally faced barriers to investment receive a share of transportation projects that is generally proportional to their presence within the regional population.
Read more: Chapter 7, Regional Demographics Evaluation and Technical Report J, Title IV and Non-Discrimination (link to draft)
See where in the region all these projects are proposed
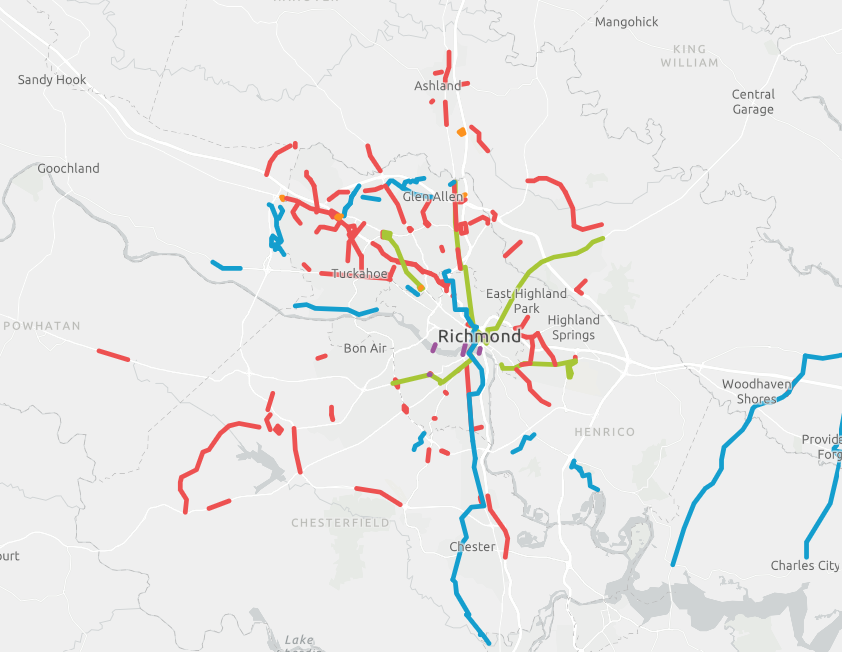
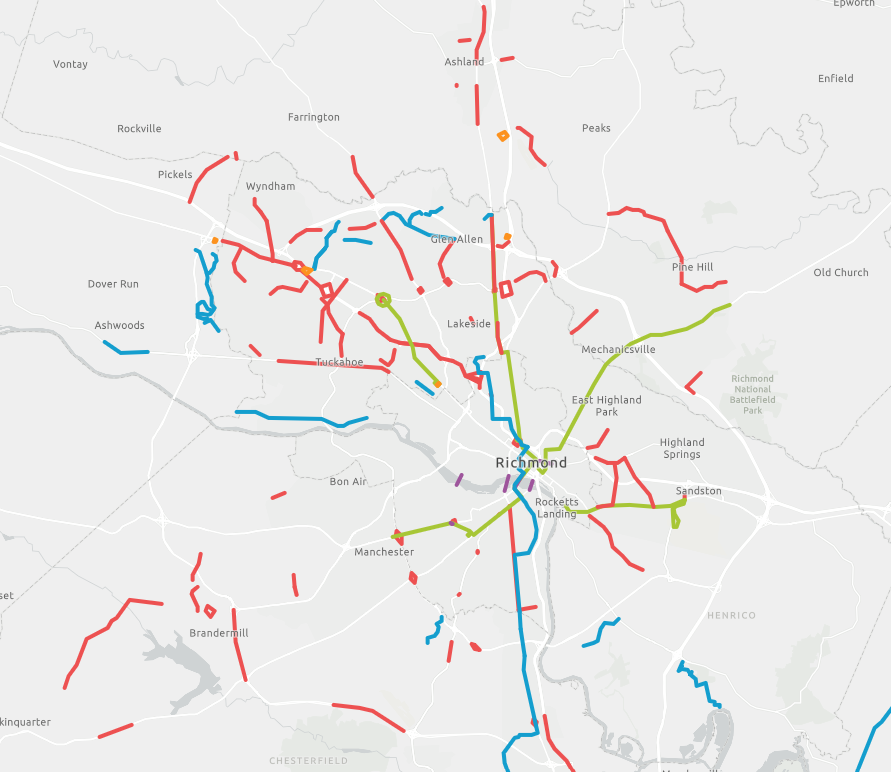
Chapter 7: Performance Based Planning Evaluations, explains how this constrained list of projects performs across different future scenarios.
Transportation is not planned in a silo, but in conjunction with future land use, movement, and housing.
We've evaluated how the entire constrained list of projects performs across each future land use scenario. Read more about scenario planning.
5 Land Use Scenarios
- Baseline (Medium Growth)
- Meh and Safe (Medium Growth)
- RVA Sinks (Low/No Growth)
- Ecotopia (High Growth)
- Back to the Future (High Growth)
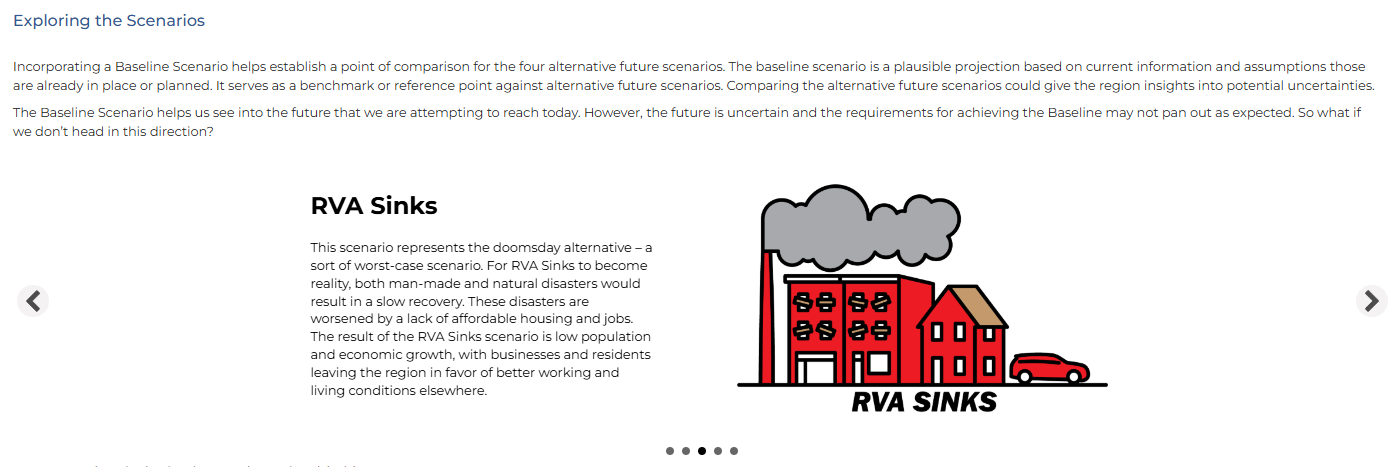
Click the image to read more about the scenarios.
Each tells a different story of how the region may grow. If we have a project list that meets our goals and vision for the region, we have to run that against each of these futures. That leads to policy considerations and needs.
Completed Input
Overall Input Snapshot
High level overview of the input from the past 2 major engagement periods.
Investment Scenarios Input
From March 11 - April 17, 2026, we shared with the public information about constrained plan funding options, the scenarios and projects contained in each, and asked for widespread feedback, including any preference for one or more packages.
We engaged with 1083 members of the public at 31 events across our region.
We asked the public to:
- View the 4 Proposed Scenario packages and maps
- View a list of projects by Scenario
- See all the projects in a map
- Read the goals definitions
Respondent Data on Investment Scenarios
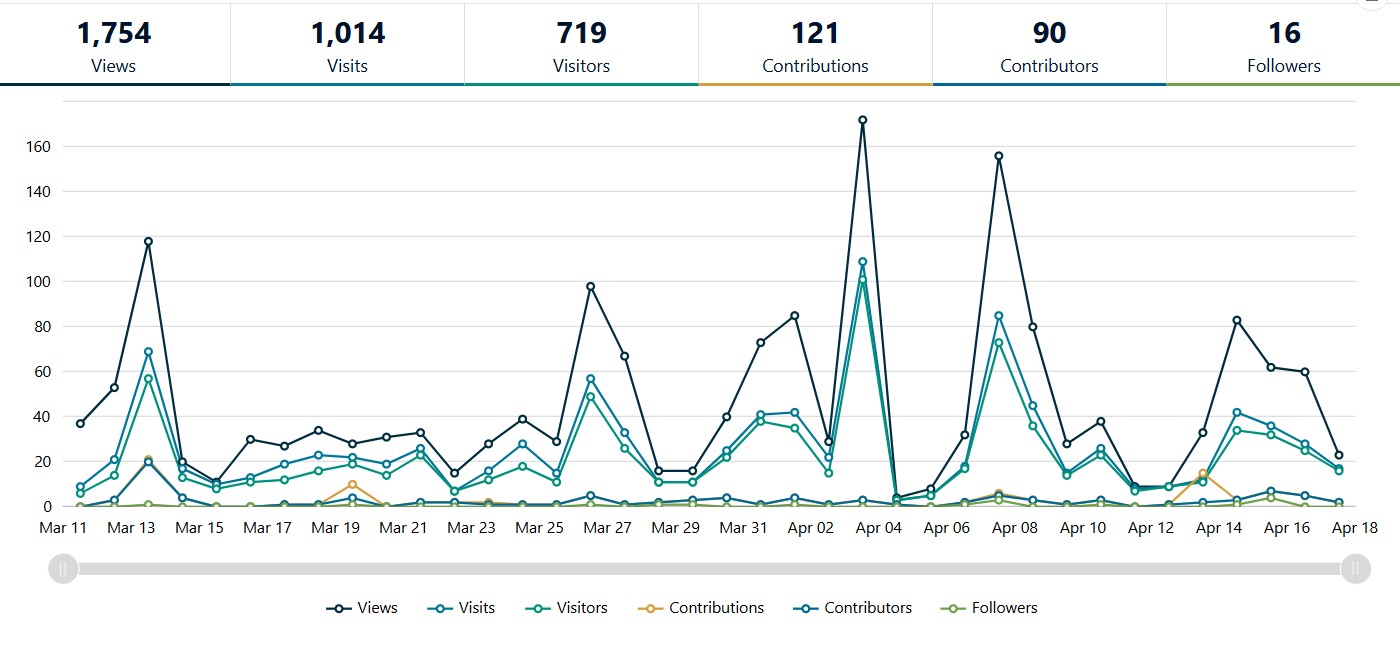
We invite you to review the respondent data summary report showing engagement during this second, investment scenario phase, where 204 comments were received via 121 form contributions submitted by 90 residents across the region.
Investment Scenario Input
- Engagement Summary Report
- Submitted Public Comments*(via form) *comments appear as submitted by contributors. They have not been altered and may contain views or language that could be offensive to some.
Below are a few at-a-glance data points. The full report includes additional features that could be of interest.
-
-
Where Respondents Live
-
Where Respondents Work
-
Respondent Age
-
Respondent Income
-
Respondent Ethnicity
Regional Goals
These regional goals were open for public comment from July 1 - July 15, 2025. This input went to the Richmond Regional Transportation Policy Board meeting on August 7.
These are the suggested GOALS for the Long Range Transportation Plan, the system of regional transportation infrastructure for the year 2050. They have been developed by subject matters experts from across the region and by staff, who have reviewed historic and current data, locality comprehensive plans, and input from the public.

Goal A-Safe
CLOSED: This discussion has concluded.
Does this feel like the right goal? Are these some of the ways we can get there?
Goal B-Clean
CLOSED: This discussion has concluded.
Does this feel like the right goal? Are these some of the activities that will accomplish it?
Goal C-Consistent
CLOSED: This discussion has concluded.
Does this feel right? Are these the ways we might get there?
Goal D-Prepared
CLOSED: This discussion has concluded.
Does this feel directionally sound? What is missing?
FAQ
FAQ
Pathways to the Future: Transportation 2050 is Richmond region’s Long-Range Transportation Plan (LRTP) which will be used to guide planning and decision making on multimodal transportation issues and needs through the year 2050. PlanRVA develops this long-range strategy to guide the effective investment of public funds for multi-modal transportation infrastructure throughout the Richmond Region.
The plan is federally mandated to cover at least the next 20 years. PlanRVA creates a 25-year plan and updates it every five years. The plan will consider fairness in all transportation spending and planning decisions in the region with a focus on transportation under-resourced communities.
There will be multiple stages and ways to give input over the next 2 years.
You can also provide input by participating in public meetings or events, completing future surveys, or sharing your ideas with us through the engagement site. Please follow the project on this site.
If you know of a community who should be connected to this work, please share their info with us at Ask a Question.
Richmond Connects is the City of Richmond's strategic plan for prioritizing multimodal transportation projects. Pathways to the Future: Transportation 2050 is a regional plan that covers not just the city but also the town of Ashland and the counties of Charles City, Chesterfield, Goochland, Hanover, Henrico, New Kent, and Powhatan.
PlanRVA staff will evaluate and incorporate input from the recommendations from Richmond Connects and other local transportation or comprehensive plans, incorporating those with regional importance into Pathways to the Future: Transportation 2050.
Alongside PlanRVA staff, the Long-Range Transportation Plan Advisory Workgroup (LRTP-AWG) will lead the creation of the plan, making independent decisions to direct the process and its results. The group includes representatives from localities, regional, state, and federal transportation partners, environmental, and community advocates from the region.
PlanRVA: created by the Virginia General Assembly in 1969, coordinates and plans for the Richmond region’s future. It manages regional programs in community development, emergency management, the environment, and transportation.
Metropolitan Planning Organization (MPO): a federally- required organization that plans transportation in urban areas with populations over 50,000 and receives federal funding.
Richmond Regional Transportation Planning Organization (RRTPO): The RRTPO is the federally recognized MPO for the Richmond region, supported by staffing infrastructure from PlanRVA.
Central Virginia Transportation Authority (CVTA): Established in 2020, CVTA funds transportation priorities in the region with staffing infrastructure from PlanRVA.
Planning Horizon: time frame considered in a plan. For example, the long-range transportation plan Pathways to the Future: Transportation 2050 looks ahead to the year 2050.
Fiscally Constrained: projects we can reasonably fund between now and 2050.
Travel Demand Model: technical tool used to predict and anticipate the level of use a road will have in the future. Projects usually address congestion like park and ride or HOV lanes.
Majority of Need
The majority of identified transportation needs are on highways (roadways classified as arterials and above). This reflects the reality that on the whole, the majority of current trips in our region happen on roads. Arterial = bigger roads, i.e. interstate, Powhite, major roads (360, 250, 33, 60) that connect region to region.
Freight
The vast majority of freight (movement of goods) happens on roadways. We have a responsibility to keep those users safe and the supply chain moving in the most efficient way possible.
We’re funding all/nearly all the transit/multimodal projects proposed.
In all the 4 scenarios, we would be funding every project proposed to us (meeting all or nearly all the overall needs) in transit/bike/ped. There are fewer of those than highway overall.
BRT (Bus Rapid Transit) expansions of 4-5 corridors are in all scenarios.
What’s in Highway?
For Safety: “Highway” issues don’t just consist of capacity changes. Often, the studies identify needs for improved interchanges or technology to reduce crashes. Safety improvements are a priority in those highway projects.
For Multimodal: There is still a multimodal component to highway. Many “highway improvements” also include sidewalk, pedestrian signaling, and bike lane installations. Additionally, addressing highway congestion actually makes transit operate more efficiently. For example, fixing bottlenecks on a major corridor by changing capacity also improves the reliability of the regional bus systems that share those same roads.
Why is some multimodal in highway? They are broad, so there is no way to divide costs to that small of a level AND because it hasn’t been designed yet.
Regionally Significant
Projects in this constrained plan are large, regionally significant projects like Bus Rapid Transit, highway expansions, and major regional trails, things which significantly change the way we travel in the region. It isn’t looking at smaller projects at all (which are often sidewalk, bike/ped). We do set aside money for that, as noted on the language on the engage page overview:
approximately 13%: allocations to our member local governments and transit operators for local-level projects (e.g. sidewalks, roundabouts, bus replacements). We don't dictate what it is used for.
Restricted Funding Source
A large chunk of our regional funding comes through VDOT and Federal Highway Administration, which is only for highway improvement (and some of is flexible and can include bike and pedestrian).
Big Picture: this is only $7.9B of the $32.5B after most was set aside for Operation & Maintenance, smaller projects across all modes, and multimodal investments we have already committed to as a region.
Toolkit
Download items needed to share about this effort
We'd love your help spreading the word so that more voices are heard. Would you share with your neighborhood association, house of worship, school, or community group?
- Print a flier to hang in your group's space
- Post to your social media and tag @planrva
-
How to Translate This Page
-
Image
-
Flier
-
Handbill
2 per page
-
Instagram Reel
MP4
-
Fb/LinkedIn Video